


How Our Expected Goals Model Works

Hockey is chaos on ice—sticks flying, bodies crashing, pucks pinging off posts, and any honest hockey fan probably knows that, more often than not, whether a shot makes it in can be fairly random. A goalie sneezes, the puck slips through. A guy shanks a shot, but it deflects in off three legs and he looks like a genius. this can make modeling hockey somewhat difficult because actual goals don’t always have the predictive power that we would like. This has led many hockey models to define expected goals (xG) as a way of cutting though the noise.
Instead of pretending that a double-doink off some poor defenseman’s shinpad is a sign of skill, xG actually measures shot quality—was it a prime scoring chance, or was the shooter just yeeting the puck from the parking lot? Over time, xG tells you who’s generating legit offense, who has sustainable skill, and who’s just getting lucky. Because let’s be honest, counting only actual goals in hockey is like judging a chef based on how often their soufflé survives an earthquake. The Off The Post model uses xG to compute team power rankings and estimate game outcomes based on team ratings and tendencies, so let’s dive into how we define xG and how xG has become a powerful input to generating our model forecasts.
The Off The Post model defines expected goals as the expected value of a shot on goal taken from a given location on the is while the goalie is on net (we don’t track empty net attempts or goals). This includes shots taken at even strength, on the power play, and shorthanded. So for example, if a player takes a shot from from the high slot, and historically, players who attempt shots from that location on the ice score goals 15% of the time, our model would say this shot generated 0.15 xG. If the shot happened to go in the net, we would credit that player with 0.15 xG and 0.85 goals added (GA) (because they should have only scored 0.15 goals, but they actually scored 1 goal). If the the goal is saved by the goalie, then we credit the player with 0.15 xG and -0.15 GA. It’s that simple!
To generate our xG model, we needed a massive dataset. We collected shot data from every attempt taken in the offensive zone while a goalie was in net since 2012, using data provided by hockey-reference.com. Each shot was labeled based on its location and whether it resulted in a goal or a save. Even with nearly a million shots recorded, the data can still exhibit some undesirable "clumping." This issue stems from the resolution at which shot locations are measured—roughly one square foot. For context, the offensive zone in hockey is about 75 by 85 feet, meaning our shot data is effectively spread across 6,000 pixels. Despite the large dataset, sample sizes in certain areas can be surprisingly thin, leading to noisy results. To smooth out the data and generate more intuitive estimations, we apply a Gaussian filter, which helps create more gradual variations in xG calculations. The results are then averaged based on local sample size to estimate xG for each location in the offensive zone. A heat map of xG is shown below.

The xG results obtained using this approach are fairly intuitive. Players convert on a fairly high percentage of shots attempted near the crease and in the low slot. As distance from the goal increases, the xG gradually tapers off, with xG dropping of fastest on the wings while remaining reasonably high in the high slot. There are some choppy areas near the center of the goal, which can be attributed to a low frequency of shots taken right in the goalie’s face as well as some evidence that the smoothing operation is mixing results from in front of the goal with results behind the goal (which are zero). However, for the overwhelming majority of results, the results are pretty reasonable and, as we will show in some future posts, have pretty good predictive power.
So, now that we have this data set, how do we use it to evaluate performance? For each game, we take the every shot attempted and label them as goals and saves. We then take the location of each shot attempt and perform a simple table look up to get the xG for that shot. If a goal was scored, the player and team are awarded GA equal to 1-xG; otherwise, the player and team are awarded GA equal to -xG. The player and team always get credit for xG regardless of if the goal is scored because they are still generating offense and scoring chances. The xG and GA can be added up over the course of the game or even the season to compare the team’s expected performance vs. the actual score board so we can see who is generating quality chances vs. who is just getting graced by the puck gods. We can also use xG and GA to evaluate goalie performance to see which goalies are doing a good job defending the crease and which goalies are being propped up by their D-men.
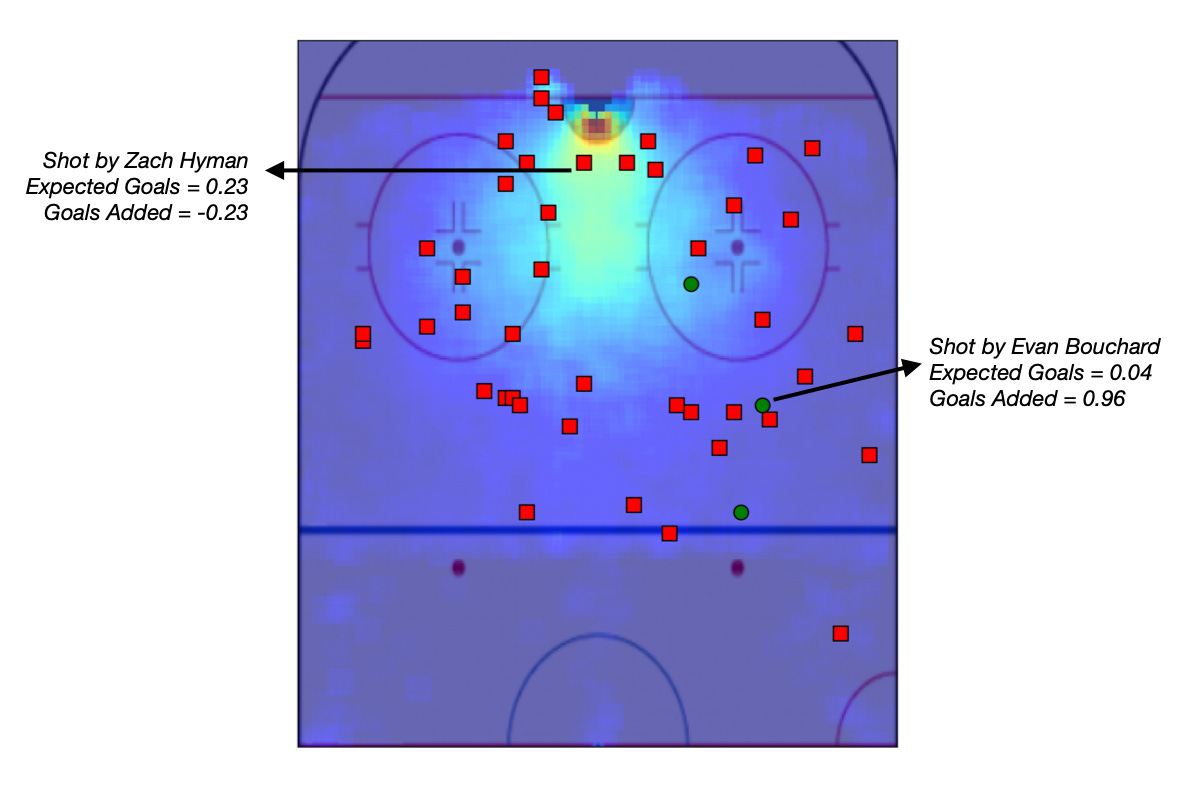
Below is in example of xG for a recent game by the Edmonton Oilers vs. the Toronto Maple Leafs on 2/5/25. Red squares indicate shots on goals that were saved by the goalie while green circles indicate goals. Example xG calculations are shown on a quality shot attempt by Zach Hyman that was stopped and goal that was scored by Evan Bouchard. Comparing the two shoats that are called out, Zach Hyman’s shot generated almost 6 times as much scoring potential as the shot by Bouchard (0.23 xG to 0.04 xG) even though it didn’t go in. Was Evan Bouchard lucky? Was Zach Hyman robbed? Did the Joseph Woll bail out his team with a heroic save? Well…it’s tough to say based on a single sample, and you probably had to be there to judge for yourself. However, in the long run, good luck tends to cancel out the bad luck, and xG can give us a better sense of who is generating consistent offense when compared to pure boxscore hunting.
While the xG model can be powerful, there are some key limitations. For one, our data only accounts for shots that made it on net and doesn’t account for shot attempts that miss the goal or were blocked by skaters before making it to the goal. This can make some predictions a bit tricky, particularly when it comes to blocked shots, since skaters don’t get credit for saving xG by blocking shots in the same way that goalies do. We also don’t account for value that is generated by set up passes, so unfortunately this model doesn’t help quantify how many xG should be credited to skaters who assist on goals (or would be goals). Despite these limitations, xG have proven to be a key part of the Off The Post model and will be the topic of multiple future posts.
Thank you for reading, and a big thank you hockey-reference.com for providing the shot location data!